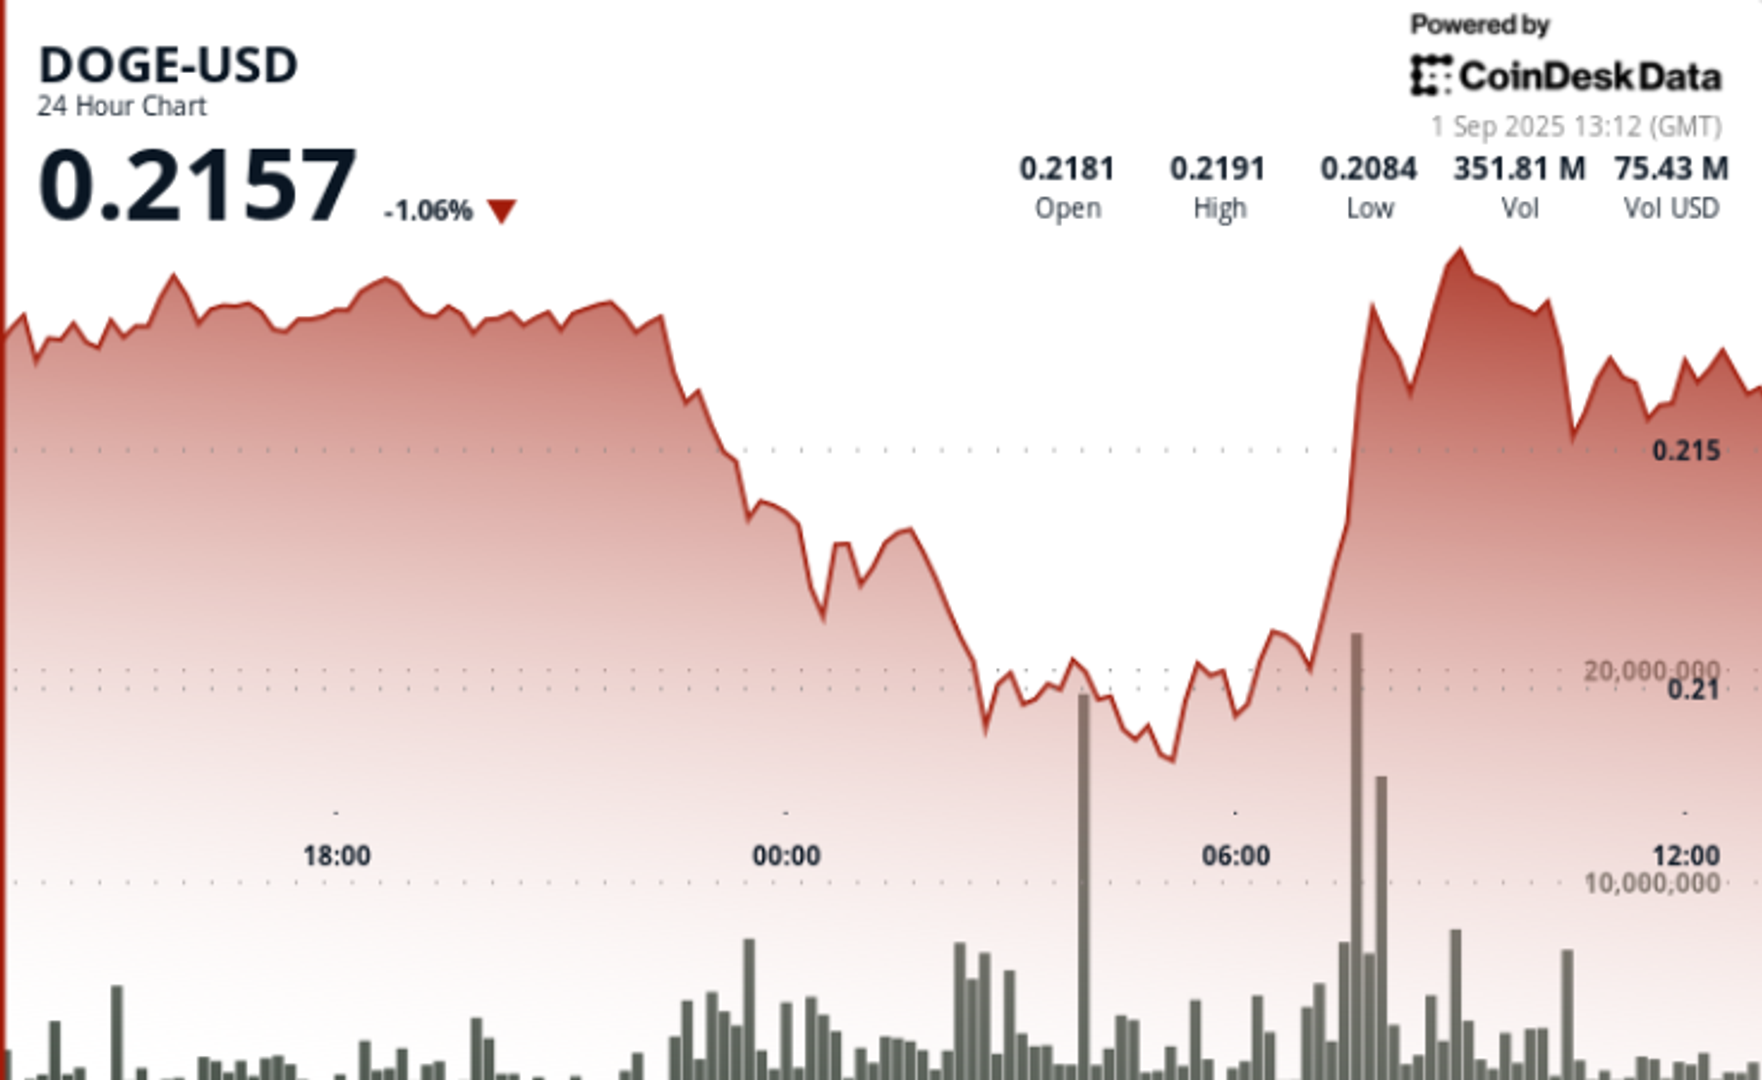
DOGE traded through a volatile 23-hour session from Aug. 31 at 13:00 to Sept. 1 at 12:00, aligning with broader choppiness in altcoins as Bitcoin slipped intraday.
On-chain trackers flagged 808.9M DOGE traded in the rebound, a ~14% jump compared with weekly averages of 378.5M, pointing to elevated institutional activity.
Broader meme-coin markets saw rotation as investors probed alternatives like XYZVerse and MAGACOIN FINANCE, highlighting diversification away from established tokens.
Macro backdrop remained cautious with geopolitical trade tensions and monetary policy divergence continuing to pressure risk assets while also driving interest in hedging tools such as DOGE.
Price Action Summary
DOGE fluctuated in a $0.01 (5%) range between $0.21 and $0.22.
Price held steady near $0.22 until 22:00 GMT Aug. 31, when selling pressure pushed the token to a $0.21 low by 05:00 GMT Sept. 1.
A strong rebound began at 07:00 GMT, lifting DOGE from $0.73 to $0.22 on 808.9M turnover, more than double the daily average.
In the concentrated 60-min window from 11:18–12:17 GMT, DOGE dipped to $0.21 before recovering to $0.22, with a 13.9M spike at 12:09 GMT confirming institutional accumulation.
Technical Analysis
Support: $0.21 established as the structural floor, repeatedly defended during overnight selloff.
Resistance: $0.22 remains the immediate ceiling; break above $0.225 is needed for continuation.
Momentum: RSI stabilizing near the mid-50s, suggesting neutral-to-bullish bias.
MACD: Histogram compression signals a potential crossover, with upside risk if volumes persist.
Patterns: Price action forming a short-term consolidation band; a cup-and-handle setup remains on watch with targets near $0.25–$0.30 if resistance clears.
Volume: 808.9M in recovery phase vs. 378.5M average underscores institutional flow behind the rebound.
What Traders Are Watching
Whether $0.21 support continues to hold under renewed sell pressure.
A decisive close above $0.225 as the trigger for a rally toward $0.25.
Futures open interest and whale exchange flows as leading indicators of sentiment shift.
Macro drivers — especially Fed signaling and trade headlines — that could tilt flows back into or away from risk assets.
This material is for informational purposes is not intended to be relied upon as a forecast, research or investment advice, and is not a recommendation, offer or solicitation to buy or sell any securities or to adopt any investment strategy. The opinions expressed are as of date of publication and are subject to change. Reliance upon information in this material is at the sole discretion of the reader. Past performance is not indicative of current or future results. This information provided is neither tax nor legal advice and investors should consult with their own advisors before making investment decisions. Investment involves risk including possible loss of principal.